
Detecting A Point In a Convex Polygon
Note: there are some interactive elements and MathML in this post. So for those reading this in RSS, if it looks like some formulas or images are missing, please click through to the post.
For reasons that may or may not be made clear lately, I’ve been working on something involving bestagons. I tended to shy away from things like this before, mainly because of the maths involved in tasks like determining whether a point is within a hexagon. But instead of running away once again from things more complex than a grid, I figured it was time to learn this once and for all. So off I went.
First stop was Stack Overflow, and this answer on how to test if a point is inside a convex polygon:
You can check that easily with the dot product (as it is proportional to the cosine of the angle formed between the segment and the point, if we calculate it with the normal of the edge, those with positive sign would lay on the right side and those with negative sign on the left side).
I suppose I could’ve taken this answer as it is, but I know if I did, I’d have something that’ll be little more than magic. It’ll do the job but I’d have no idea way. Now like many, if I can get away with having something that works without me knowing how, I’ll more likely to take it. But when it comes to code, doing this will usually comes back to bite me in the bum. So I’m trying to look for opportunities to dig a little deeper than I would in learning how and why it works.
It took me a while, and a few false starts, but I think I got there in the end. And I’d figured it would be helpful for others to know how I came to understand how this worked at all. And yeah, I’m sure this is provable with various theorems and relationships, but that’s just a little too abstract for me. No, what got me to the solution in the end was visualising it, along with attempting to explain it below.
First, let’s ignore polygons completely and consider a single line. Here’s one, represented as a vector:
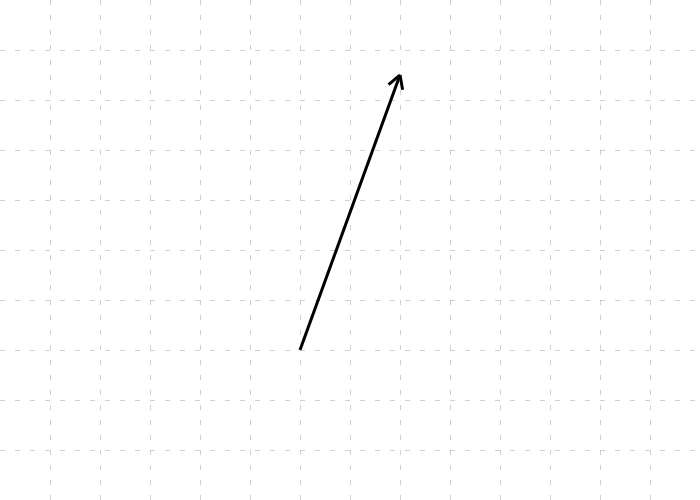
Oh, I should point out that I’m assuming that you’re aware of things like vectors and trigonometric functions, and have heard of things like dot-product before. Hopefully it won’t be too involved.
Anyway, we have this line. Let’s say we want to know if a specific point is to the “right” of the line. Now, if the line was vertical, this would be trivial to do. But here we’ve got a line that’s is on an angle. And although a phrase like “to the right of” is still applicable, it’ll only be a matter of time before we have a line where “right” and “left” has no meaning to us.
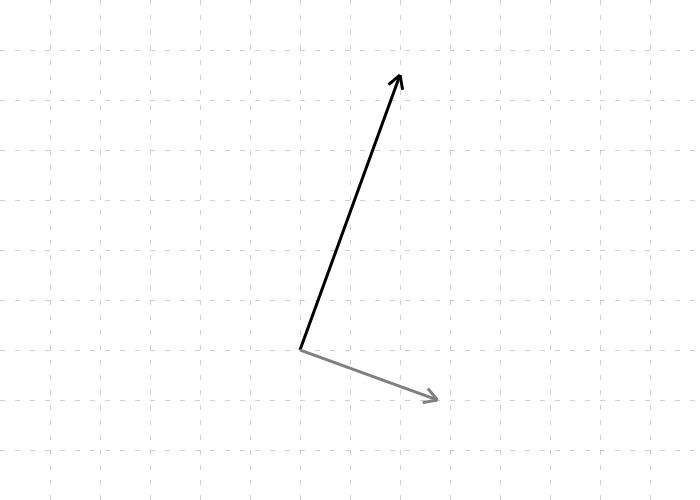
So let’s generalise it and say we’re interested in seeing whether a point is on the same side as the line’s normal.
Now, there are actually two normals available to us, one going out on either side of the line. But let’s pick one and say we want the normal that points to the right if the line segment is pointing directly up. We can add that to our diagram as a grey vector:
Now let’s consider this point. We can represented as a vector that the shares the same origin as the line segment1. With this we can do all sorts of things, such as work out the angle between the two (if you’re viewing this in a browser, you can tap on the canvas to reposition the green ray):
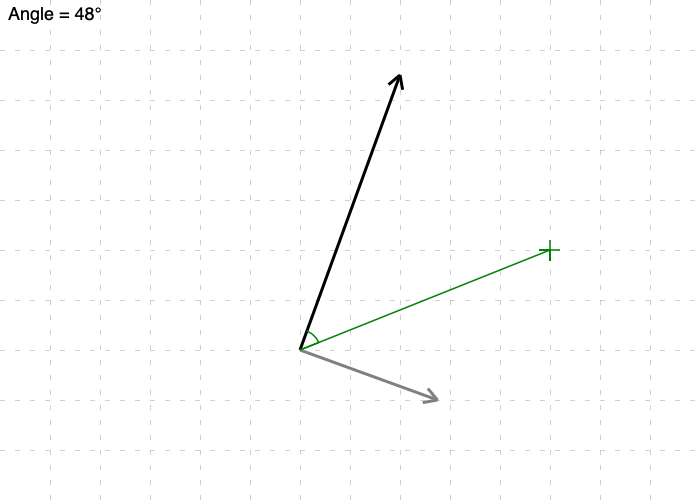
This might give us a useful solution to our problem here; namely, if the angle between the two vectors falls between 0° and 180°, we can assume the point is to the “right” of the line. But we may be getting ahead of ourselves. We haven’t even discussed how we can go about “figuring out the angle” between these vectors.
This is where the dot product comes in. The dot product is an equation that takes two vectors and produces a scalar value, based on the formula below:
One useful relationship of the dot product is that it’s proportional to the cosign of the angle between the two vectors:
Rewriting this will give us a formula that will return the angle between two vectors:
So a solution here would be to calculate the angle between the line and the point vector, and as long as it falls between 0 and 180°, we can determine that the point is on the “right” side of the line.
Now I actually tried this approach in a quick and dirty mockup using JavaScript, but I ran into a bit of an issue. For you see, the available inverse cosign function did not provide a value beyond 180°. When you think about it, this kinda makes sense, as the cosign function starts moving from -1 back to 1 as the angle is greater than 180° (or less than 0°).
But we have another vector at our disposal, the normal. What if we were to calculate the angle between those two?
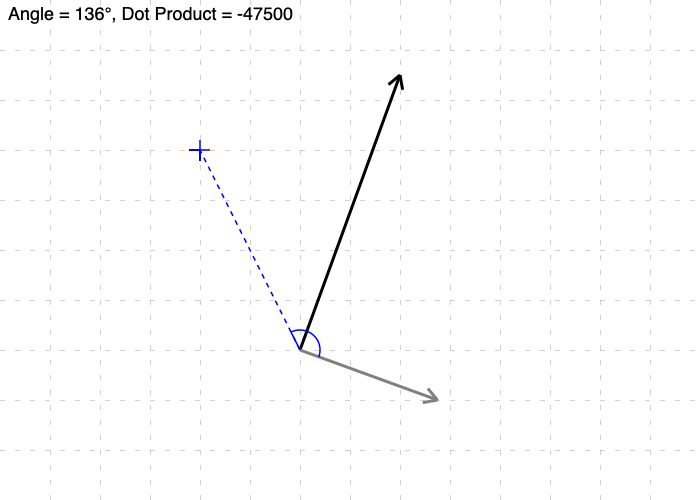
Ah, now we have a relationship that’s usable. Consider when the point moves to the “left” of the line. You’d notice that the angle is either greater than 90° or less than –90°. These just happen to be angles in which the cosign function will yield a negative result. So a possible solution before is is to work out the angle between the point vector and normal, take the cosign, and if it’s positive, the point will be on the “right” side of the line (and it’ll be on the “left” side if the cosign is negative).
But we can do better than that. Looking back at the relationship between the dot product and the angle, we can see that the only way this equation could be negative is if the cosign function is negative, since the vector magnitudes will always return a positive value. So we don’t even need to work out angles at all. We can just rely on the dot product between the point and the normal.
And it’s here that the solution clicked. A point is to the “right” of a line if the dot product of the point vector and the “right”-sided normal is positive. Look back at the original Stack Overflow answer above, and you’ll see that’s pretty much what was said there as well.
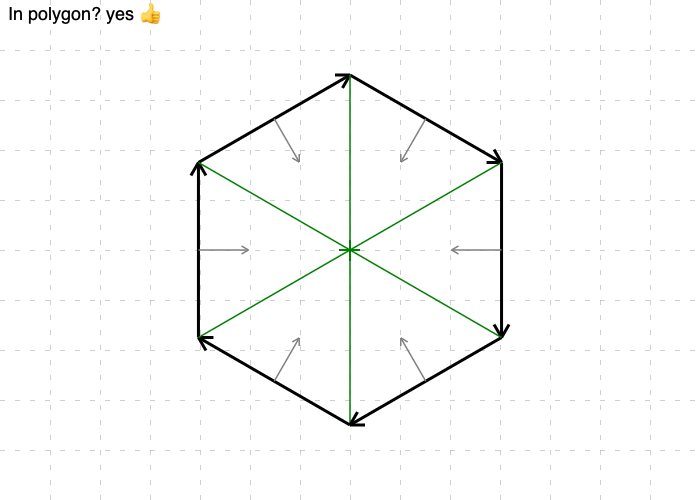
Now that we’ve got this working for a single line, it’s trivial to extend this to convex2 polygons. After including all the line segments, with the normals pointing inwards, calculate the dot product between each of the normals with the point, and check the sign. If they’re all positive, the point is within the polygon. If not, it’s outside.
So here’s an approach that’ll work for me, and is relatively easy and cheap to work out. And yeah, it’s not a groundbreaking approach, and basically involved relearning a bunch of linear algebra I’ve forgotten since high school. But hey, better late than never.